
Webmecanik Pipeline offers significant statistics regarding your opportunities, contacts, and companies. These statistics help you analyze various data (opportunities, activities, etc.) that are valuable for refining your sales strategy.
What are the different statistics available in Webmecanik Pipeline?
To access all this data, go to the Statistics tab.
Sales Performance
Sales performance provides visibility into the number of won and lost opportunities, the generated revenue, and the average deal duration.
Won Opportunities
This graph gives you access to the amounts of different opportunities won over the last 3, 6, and 12 months.
Won Opportunities vs. Lost Opportunities
This graph allows you to compare the number of opportunities won and lost.
Estimated earnings
This graph indicates the potential of your opportunities and the opportunities already won in the next 3, 6, and 12 months.
Opportunity Progression
This graph provides access to the progression in terms of amount for your various opportunities over the last 3, 6, and 12 months. Each status in your pipeline has its own total amount.
Sales activities evaluation
This graph offers a summary of the number of your activities based on their Owner and Status.
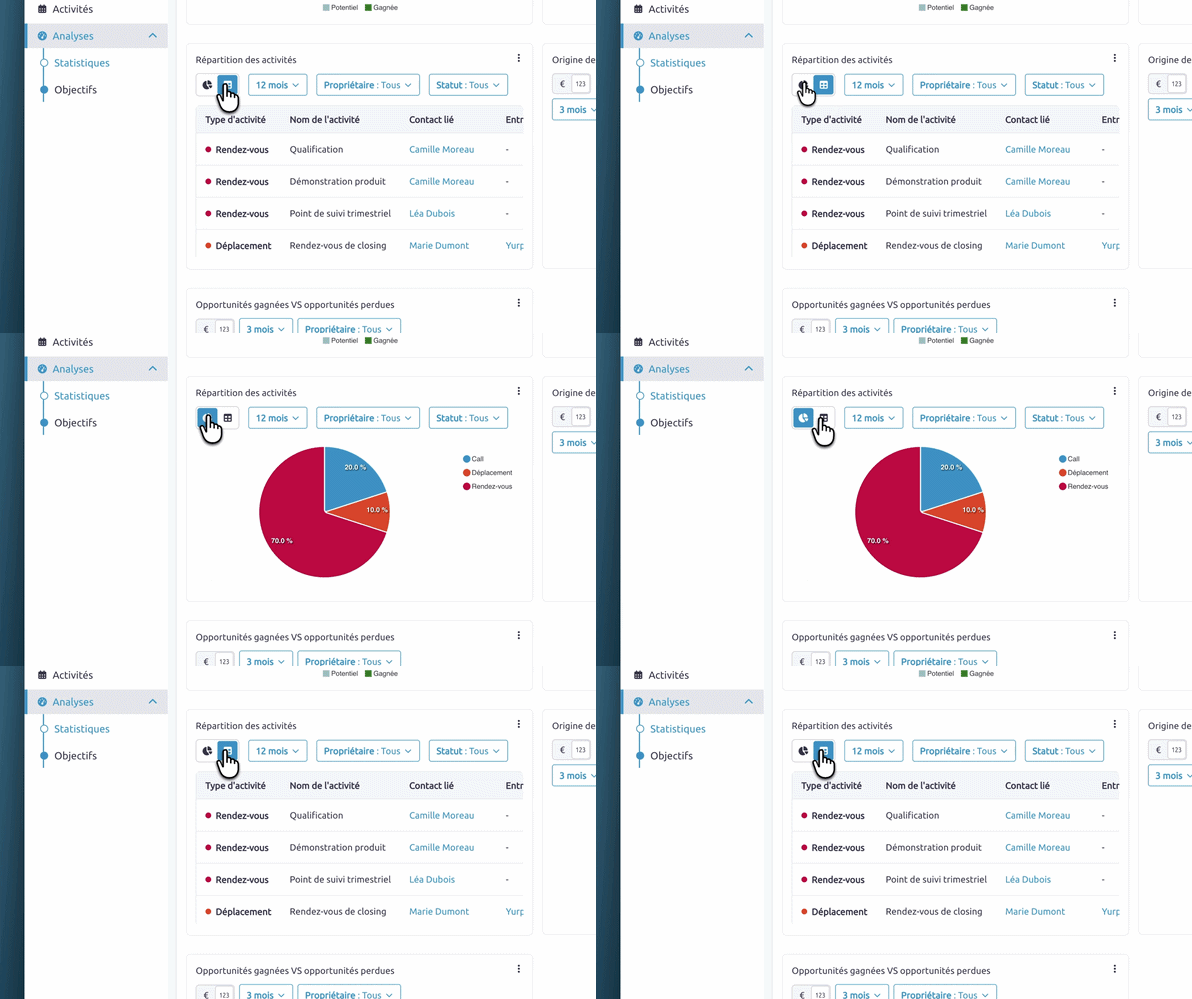
Activity Shares
On this graph, you can find the distribution of your activities based on their Status and Owner.
Viewing Statistics
Switch between a graphical view to quickly identify trends and a table view to access detailed data.
Analyze your performance more easily with a detailed, filterable view that you can explore with just a few clicks.
Comments
0 comments
Please sign in to leave a comment.